Data Analytics
Structuring the problem is the first step, and sometimes quite a big one. The next step to understanding a system is to see what objective information is available on the behaviour of the system and what this might be telling us.
In the early days of Operations Research the first step was often to collect simple data about the system, whether that was miss distances for bombs or U-boats encountered per aircraft flight in an area. The next step was to draw a graph. Drawing graphs of the relationships between important input variables and measures of effectiveness of the system help to understand what key factors are driving the important outputs of the system.
Nowadays vast quantities of data are collected and stored on every aspect of our lives. This data has the potential to reveal valuable insights into our behaviour. Whether this is Google showing you exactly the right advertisement for you on that particular day or whether it is Tesco working out which offers are most likely to draw customers into store on a summer weekend, data analysis is now big business.
At Larrainzar Consulting we use data to give our clients insight into the behaviour of the systems that they deal with in the real world.
Just Draw a Graph
The most important information can sometimes be obtained very simply. The important thing is to gather the right kind of data and then to show it in as clear and simple a way as possible. Sometimes the most thorny problems can be better understood just by drawing a simple graph.
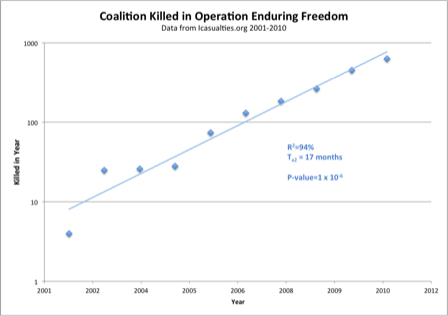
An example of this is shown to the right. Counter-insurgency is a complex business, we are all told. It involves many different factions, all working to different agendas and competing with each other on a battlefield that is as much about hearts and minds as it is about territory and dead bodies. Despite this, the graph to the right shows that the Afghan insurgency has shown astonishingly regular behaviour for most of the period from 2005 to 2011, with annual coalition losses doubling approximately every 17 months.
Understanding this allows a number of insights. One is that the problem may be much less responsive to all of the various initiatives and strategies that were being tried over this period than policy-makers at the time may have thought. Another is that there must be some underlying process that leads to this kind of regular behaviour - in this case the underlying model seems to be one of exponential growth, so some sort of positive feedback mechanism is likely to be driving the behaviour.
Forecasting
Forecasting is an important tool used by Operational Researchers to help with problems ranging from how much ice-cream a supermarket should order each month through to the likely behaviour of commodities markets and financial instruments.
Many forecasting tools are surprisingly simple conceptually, and often rely upon Bayesian approaches that combine new information and previous estimates to provide a regularly updated estimate of what might be expected in the next month.
Depending upon the form of algorithm used, forecasting can be optimised to respond rapidly to small changes in the expected value of a variable or to be better at pulling out long term signals from the data.
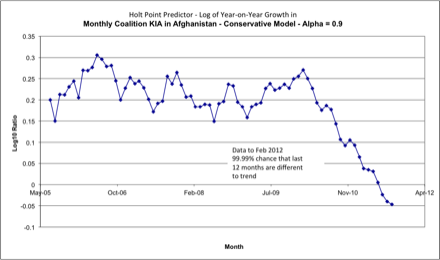
The graph to the right is designed to detect deviations from the long term trend shown in our first graph. Insurgency casualties we have seen grow in a very regular fashion - until they hit the limit on their growth. This limit is shown here, as the behaviour of the Afghan insurgency changes from mid-2010, with it becoming increasingly apparent that a significant change in behaviour had occurred. By February 2011, when this graph was produced, we could state with some confidence that the behaviour of the insurgency had fundamentally changed.
Many forecasting tools are surprisingly simple conceptually, and often rely upon Bayesian approaches that combine new information and previous estimates to provide a regularly updated estimate of what might be expected in the next month.
Depending upon the form of algorithm used, forecasting can be optimised to respond rapidly to small changes in the expected value of a variable or to be better at pulling out long term signals from the data.
The graph to the right is designed to detect deviations from the long term trend shown in our first graph. Insurgency casualties we have seen grow in a very regular fashion - until they hit the limit on their growth. This limit is shown here, as the behaviour of the Afghan insurgency changes from mid-2010, with it becoming increasingly apparent that a significant change in behaviour had occurred. By February 2011, when this graph was produced, we could state with some confidence that the behaviour of the insurgency had fundamentally changed.
Cluster Analysis
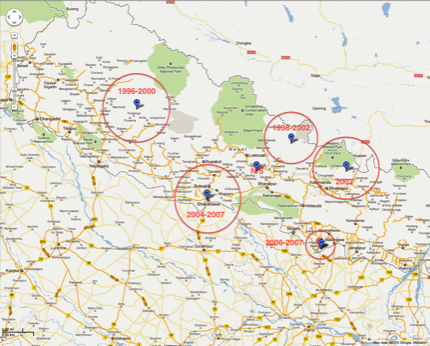
Statistical approaches can also be used with geographical data. Software ordinarily used to detect outbreaks of disease has here been used to show centres of activity in the Nepalese insurgency.
This approach relies upon calculating whether or not the density of events in a given window of time and space is greater than would be expected by chance. This is the same kind of approach as is used to look for unusual incidence of cancers in particular areas or particular populations or to identify where the epicentre of a disease outbreak lies.
Cluster analysis can also be used for non-geographical purposes, identifying patterns of behaviour that tend to go together. This is one of the approaches used in data mining to identify typical types of customer.
Logistic Regression
Another powerful technique is logistic regression. Logistic regression is a technique often used in medicine to calculate risk in long-term studies. Thus the risk of suffering a heart attack might be twice as great in the overweight as in the general population. This kind of estimate is produced using logistic regression. Logistic regression takes outputs that are either true or false - an individual who either did or did not have a heart attack, and combines this with input variables that can either be true or false - the victim was overweight, or can be ordinary numeric variables - the BMI of the victim for example.
Logistic regression is a powerful technique for understanding what influences a seemingly binary and random outcome. It tends to need reasonably large amounts of data to work effectively, though strong effects will show through even in small samples.
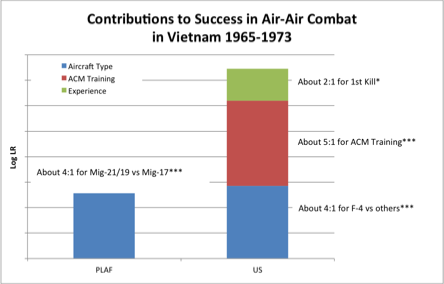
The results of logistic regression can sometimes be hard to understand. The graph on the right shows how the results of logistic regression can be presented in a more comprehensible fashion. Here we see the various contributions to success in air-to-air combat in Vietnam. The Top Gun effect is shown in red, and can be seen to be clearly greater than either the effect of experience shown in green or the effect of technology as shown in blue. These bars all represent the log of the likelihood ratio, and can therefore be added. The baseline represents a 1:1 exchange ratio.
Logistic regression is a powerful technique for understanding what influences a seemingly binary and random outcome. It tends to need reasonably large amounts of data to work effectively, though strong effects will show through even in small samples.
The results of logistic regression can sometimes be hard to understand. The graph on the right shows how the results of logistic regression can be presented in a more comprehensible fashion. Here we see the various contributions to success in air-to-air combat in Vietnam. The Top Gun effect is shown in red, and can be seen to be clearly greater than either the effect of experience shown in green or the effect of technology as shown in blue. These bars all represent the log of the likelihood ratio, and can therefore be added. The baseline represents a 1:1 exchange ratio.